
In online stock trading, beginners usually get stuck in certain places because of fluctuations in market prices. There are times when new traders make poor decisions because of either greed or fright, making them lose part of what they originally invested.
But what if we tell you that there’s a tool that could help you in making trades?
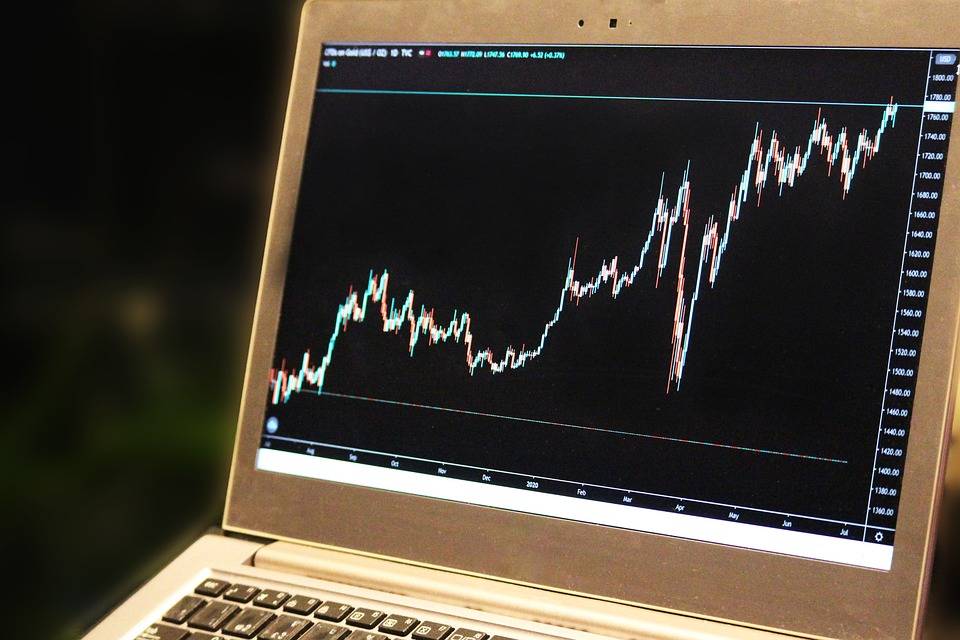
Candlestick graphs give twice as much information as standard line charts if you know how to read them. They also allow you to interpret price data more advanced way and look for distinct patterns that provide clear trading signals.
Trade Charting Methods and Candlestick Chart Patterns
Traders use these trade ideas charting methods to predict future price movements. These help in identifying trends, reversals, continuation patterns, and potential trading opportunities.
Trade charting method is to find trade setups and indicates probabilities of success. By using this, traders can take advantage of market movements and make informed decisions about their trading strategies.
Candlesticks patterns are graphical representations of prices. These patterns are created by plotting price data on a chart, with the thickness of the candlesticks representing the price action over a specific period. The chart’s pattern can be used to identify potential reversals in the market, as well as to confirm trends.
The importance of candlestick patterns is that they can be used to predict future market movements. These patterns can be used to predict future market movements, as well as to identify potential reversals, helping you make an informed decision about whether to buy or sell your investments.
Various trading software tools are available that can help traders to identify and analyze candlestick patterns. These tools can be used to identify the most reliable patterns, allowing traders to make informed decisions about their trading strategy.
Let’s take a look at the candlestick chart’s most noticeable features.
- Candlesticks patterns are used to predict future price movements of a security.
- These are created by combining the open, high, low, and closed price data for security.
- It can be used to identify trends, reversals, and continuation patterns.
- Traders use them to make decisions about when to buy, sell, or hold a security.
- They are used with other technical indicators to provide a complete picture of the market.
- These are best used on longer timeframes, such as daily or weekly charts.
Analyzing Candlestick Patterns Using Trading Software
There are many different ways to analyze candlestick chart patterns, but one of the most popular methods is using stocks trading software.
Trading software is one of the most popular methods This type of software is designed to help traders identify and trade candlestick patterns. One of the most popular candlestick pattern trading software programs is candlestick warrior. This software program includes a Candlestick Pattern Recognition indicator too.
The candlestick pattern recognition indicator tool is a powerful tool that can help traders identify and trade a variety of candlestick patterns. This tool can be used to identify over 30 different candlestick patterns, which can be very helpful for traders who are trying to find trading opportunities.
Another popular candlestick pattern trading software tool is the candlestick reversal finder. It includes a reversal scanner that can be used to identify potential reversal patterns. The reversal scanner is designed to scan for a variety of different candlestick patterns, and it can be very helpful for traders who are trying to find trading opportunities.
Using these tools and software helps you in:
- Scanning candlestick patterns
- Identifying potential reversal patterns
- Finding trading opportunities
Guide to Reading Candlestick Chart Patterns
Step 1. Identify The Type of Pattern You Are Dealing With
The most vital step in reading candlestick chart patterns is to identify the type of pattern you are dealing with. Identifying these patterns is important because they all have different implications for your trading strategy.
There are three main types of online stock trading candlestick patterns:
- Continuation patterns: Continuation patterns are patterns that indicate that a particular trend is likely to continue. These patterns are often found after a strong move in the market. These are used to confirm that the move is likely to continue.
- Reversal patterns: These patterns indicate that a particular trend is likely to reverse. These patterns often occur after a prolonged period of consolidation. These are used to confirm that the trend is to reverse.
- Breakout patterns: They indicate that a particular market is likely to break out. These patterns often occur after a long period of consolidation. These are used to confirm that the market is likely to break out.
There are also several specific candlestick patterns, each with a slightly different meaning. Some of the more common patterns are the Doji, the Hammer, and the Shooting Star.
Step 2. Analyze The Pattern
Once you have identified the type of pattern you are dealing with, you can begin to look for specific candlestick patterns that fit that category. Each pattern has its unique characteristics, and you should be familiar with their characteristics to identify them.
The most important thing to remember when analyzing candlestick chart patterns is that they are not exact science. They are a guide, and they should not be used as the sole basis for your trading decisions. It is also important to remember that candlestick chart patterns are not always accurate.
Sometimes, the market will move in a way that is not anticipated by the pattern, and this can lead to losses. When you are first starting, it is a good idea to practice reading candlestick chart patterns on a demo account. This will allow you to get a feel for how the patterns work, and it will also allow you to practice identifying them.
As a beginner, it is often helpful to use candlestick charting or any stock trading software to make this analysis easy. For example, A Doji is a type of candlestick pattern that signals indecision in the market. It is formed when the opening and closing of a candlestick are equal, or close to equal. Also, many automated trading systems use the Doji pattern as a signal to enter or exit a trade.
Step 3. Determine the Potential Outcome of the Pattern
After you have analyzed the pattern and determined which one it is, you need to determine the potential outcome of the pattern. Each pattern has a different meaning, and this meaning can help you determine what the market is likely to do next.
Some patterns are more reliable than others, and you should always consider this when making your trading decisions. The potential outcome of a candlestick pattern can be determined by its prior price action, the size of the candlestick, and its volume.
For example, the Harami pattern is very reliable. It often signals a reversal in the market. This means that if the market is in a downtrend, the Harami pattern often signals that the market is about to turn around and start moving up.
But remember, even the most reliable candlestick patterns can fail. As with any technical indicator or tool, candlestick patterns should be used with other forms of analysis.
Step 4. Place Your Trade
Once you have determined the potential outcome of the candlestick pattern, you can place your trade.
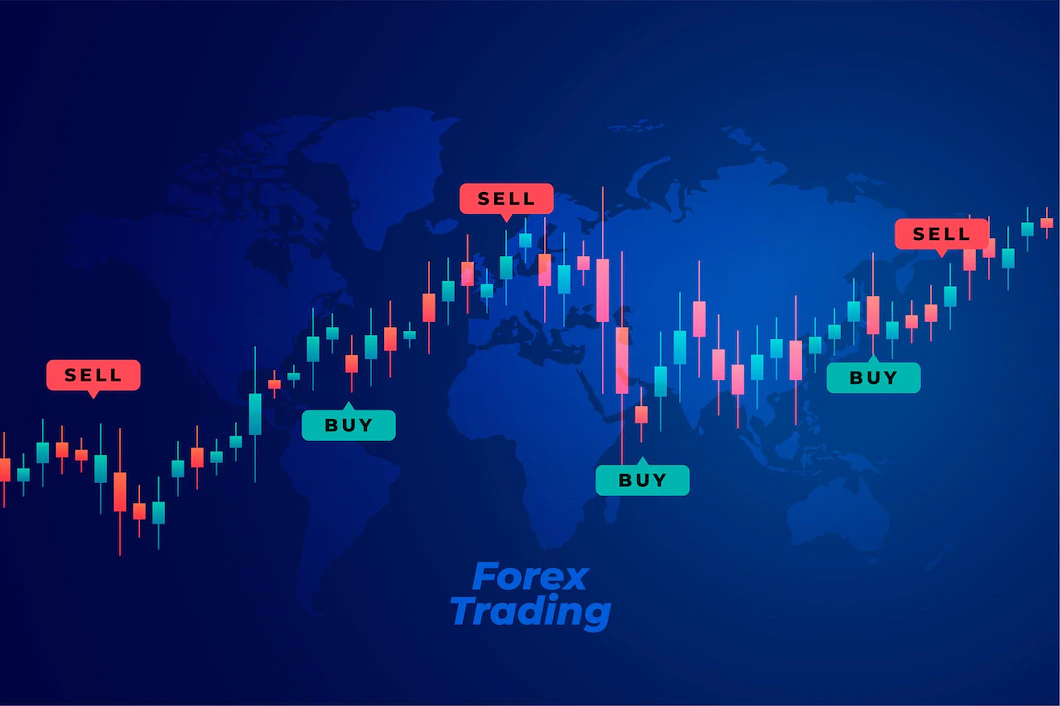
For example, if the pattern is bullish, you would buy the security. But, if the pattern is bearish, you would sell the security. This is because you would expect the price to move in the opposite direction of the pattern.
For this particular candlestick pattern, you would buy the security. As a result, you would place a stop-loss order below the low of the pattern. Your target would be determined by your risk-reward ratio. But remember, even the most reliable candlestick patterns can fail.
As such, it is important to always use stop-loss orders when trading candlestick patterns.
Final Words
The most important thing to remember when trading candlestick patterns is that nothing is 100% accurate. Candlestick patterns are simply a tool that you can use to make better trading decisions.
When you are using candlestick patterns, be sure to combine them with other technical analysis tools, such as support and resistance levels, Fibonacci levels, and moving averages. This will help you confirm the candlestick pattern and make a more informed trading decision.